Börsens vilda berg-och-dalbana 2025 – i sex grafer
USA-börsen gick igenom ett av sina mest dramatiska år på länge under 2025. I april föll S&P 500 nära nog ner i björnmarknad när president Donald Trumps tullplaner skrämde investerare.
Men när tullarna senare sköts upp vände marknaden snabbt uppåt, drivet av starka bolagsvinster och ny AI-entusiasm. Volatiliteten var extrem.
– Det var Trump 1.0 på steroider, säger Keith Lerner, investeringschef på Truist Advisory Services.
Bloomberg sammanfattar det vilda börsåret i sex grafer.
The Stock Market’s Wild 2025 Roller-Coaster Ride in Six Charts
This was a year of extremes for the US stock market.
The S&P 500 Index plunged to the verge of a tariff-induced bear market in April, only to quickly rebound after President Trump relented and by late June was hitting repeated records fueled by enthusiasm for all things artificial intelligence.
The vertigo-inducing swings can be seen in the Cboe Volatility Index, also know as the VIX, which measures anticipated price moves in stocks. On April 8, it soared to above 50 for the first time since the pandemic and just the second time since the financial crisis as the Trump administration’s sweeping tariff plans gripped the market in fear. Then it quickly tumbled when Trump delayed his levies for three months, falling below 20 by May, where it’s currently sitting.
“It was Trump 1.0 on steroids,” said Keith Lerner, chief investment officer and chief market strategist at Truist Advisory Services Inc., who added that he can’t remember the last time US political decisions spurred that level of volatility in the stock market.
Ultimately, resilient corporate profit outlooks, thanks in part to AI-linked spending rescued investors. The S&P 500 is up 16% for the year after being down 15% in April, and is on its way to a third straight year of double-digit gains.
Here are six charts that detail the swings and challenges in a wild 2025 for the stock market.
Fund Outflows
Equities trading in 2025 can be divided into April and everything that came after. Trump’s tariffs nearly ended the multi-year bull market, as many exchange-traded funds had sharp net outflows in April.
“The pace and intensity of equity ETF flows did slow from roughly March through the summer as investors reflected on the impact of tariffs on the market environment,” said Todd Sohn, senior ETF and technical strategist at Strategas Securities. The outflows from cyclical sectors in that period is “consistent with reduced risk appetite.”
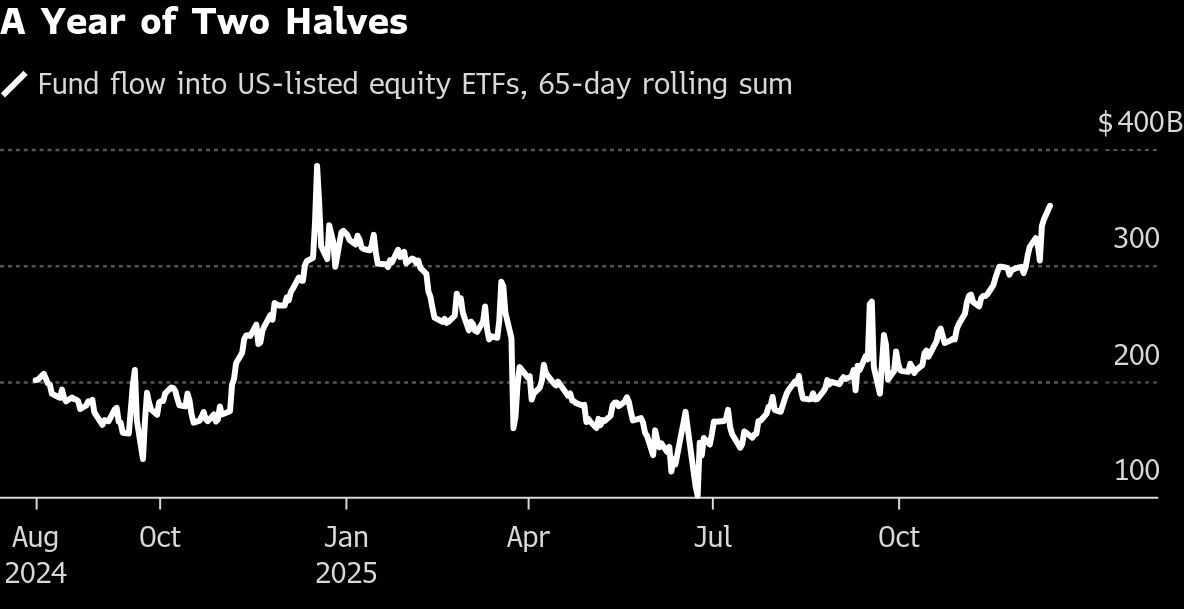
The Invesco QQQ Trust Series 1 ETF, which tracks the Nasdaq 100 Index, saw its first net outflow in seven months in April as traders pulled money at the fastest pace in over two years that month. But as the tariff plans were reversed so did the selling pressure, and QQQ’s inflows resumed with a burst in May.
Rapid-Fire Target Changes
Forecasting where the US stock market will end any year is a challenge. But 2025 was next level. Almost every major Wall Street bank slashed its S&P 500 outlook in reaction to the Trump administration’s sweeping tariff program. Then they all had to bring their targets back up as the policy was relaxed, corporate profit expectations rebounded and stock prices took off.
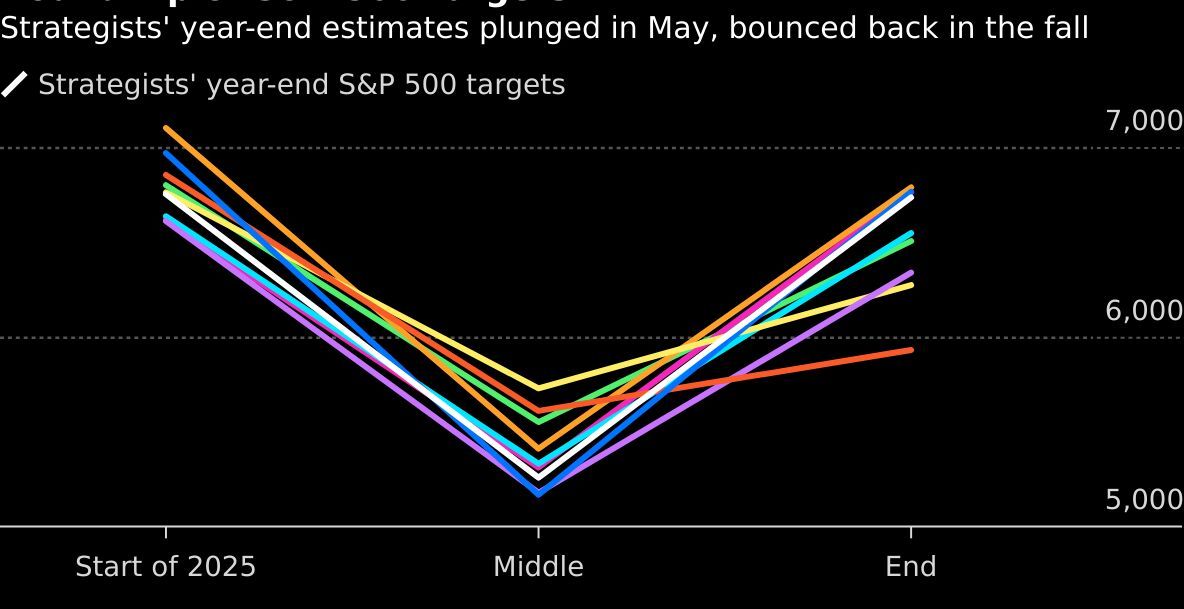
“We did reduce our year-end target because we knew that historically the market took four months to go from a correction to get back to break even,” said Sam Stovall, chief investment strategist at CFRA.
The last time market strategists had to dramatically cut their forecasts en masse like that was at the onset of the Covid-19 pandemic in 2020, Stovall said. But 2025 presented an additional challenge because the drastic shift in trade policy shrank the historical timeline for the market to move from correction to recovery to two months instead of the usual four, he added.
Bubble Concerns
At the very beginning of 2025, before the release of the DeepSeek chat bot ignited fears about AI valuations and increased competition from China, legendary investor Howard Marks warned that he was “on bubble watch.” The call was notable because the co-founder of Oaktree Capital Management was among the investors who correctly predicted the dot-com bust of 2000.
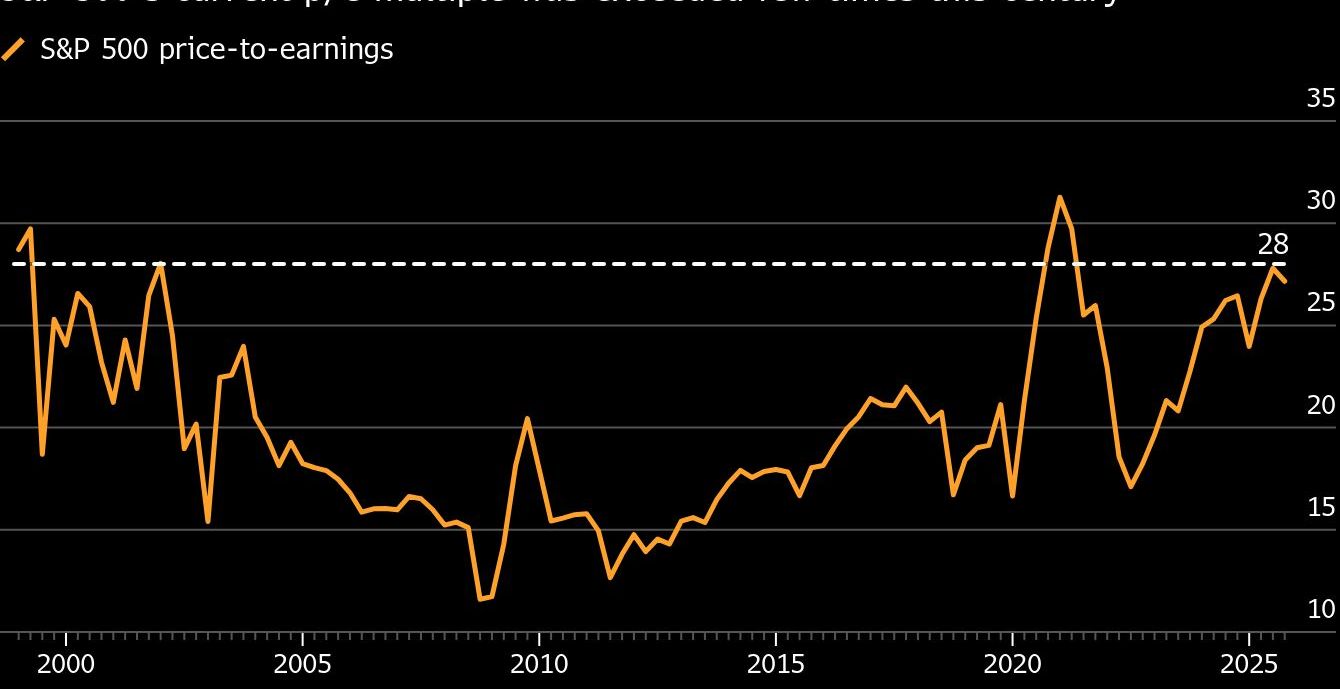
More strategists have issued similar warnings since Marks published his memo on Jan. 7, as S&P 500 valuations climbed to their highest level since the pandemic. Last week, Ned Davis Research strategists said that semiconductor stocks meet the definition for an equities bubble established by professors at Harvard Business School in a 2017 research paper.
That said, this is hardly a consensus view. BofA Global Research strategists wrote in a note Wednesday that they “don’t yet see an AI bubble.” And Wall Street analysts are expecting income growth by S&P 500 companies to accelerate each year through 2027, according to data compiled by Jefferies.
Concentration Risk Rising
The 10 largest stocks in the S&P 500 account for almost 40% on the US equities benchmark. That’s a historically high figure that’s giving investors heartburn over concentration risk.
The increasingly concentrated market faces “reflexive risks,” particularly as the handful of dominant names become more correlated to each other, according to Dean Curnutt, founder and CEO of Macro Risk Advisors. He sees the Magnificent Seven tech giants — Alphabet Inc., Amazon.com Inc., Apple Inc., Meta Platforms Inc., Microsoft Corp., Nvidia Corp. and Tesla Inc. — as a potential “circular acquiring squad” where “cash is simply being recycled, creating more market cap gains.”
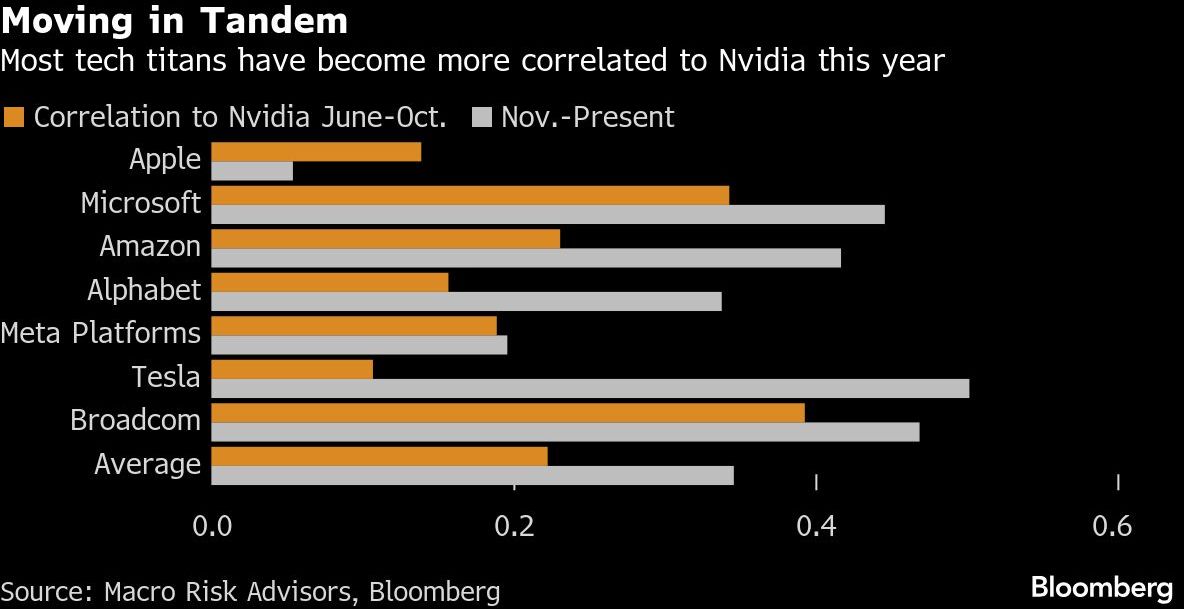
“The S&P as an index is doing a very poor job of providing a diversified set of exposures,” Curnutt said. “Here you have an index that is absurd in terms of its top heaviness.”
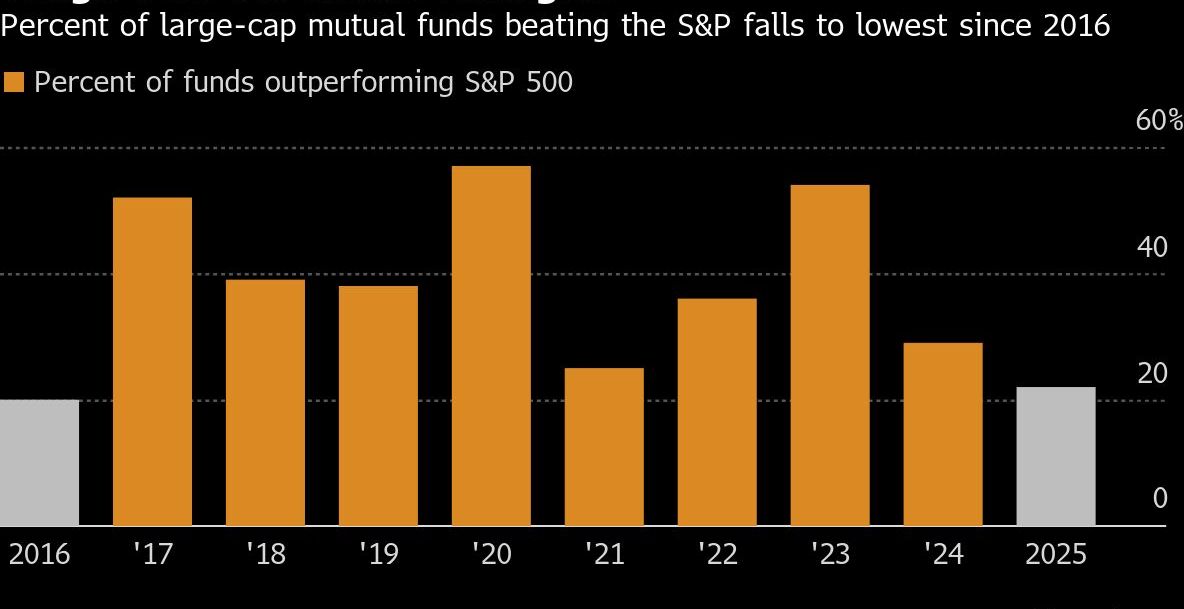
Actively Challenging
About 45% of the S&P 500’s gains in 2025 came from the Magnificent Seven. While investors who own index-tracking ETFs have benefited, active fund managers who pick stocks and build diverse portfolios to mitigate concentration risk have struggled.
Only 22% of actively managed large-cap funds have outperformed the S&P 500 this year, the lowest proportion since 2016 and well below the average of 40%, according to BofA Global Research data.
Fund managers have been selling tech stocks to the point where they’re the most underweight the sector in five years, contributing the underperformance of active funds, Seaport Research Partners said in October.
However, that is likely to change next year as the rally broadens out, said Steven DeSanctis, an analyst at Jefferies. He’s hardly alone. Goldman Sachs flow specialists said Thursday that stock pickers may “rejoice” in 2026 as equities move more independently of each other. And JPMorgan Chase & Co. strategists see investors “at the gates of the best stock-picking era we have seen in our lifetime”
American Unexceptionalism
Despite the US stock market’s intense rally from its April lows, it’s still losing to international benchmarks. The S&P 500 is underperforming its global peers and the MSCI World Ex-US Index for the first time in a rising market since 2017.
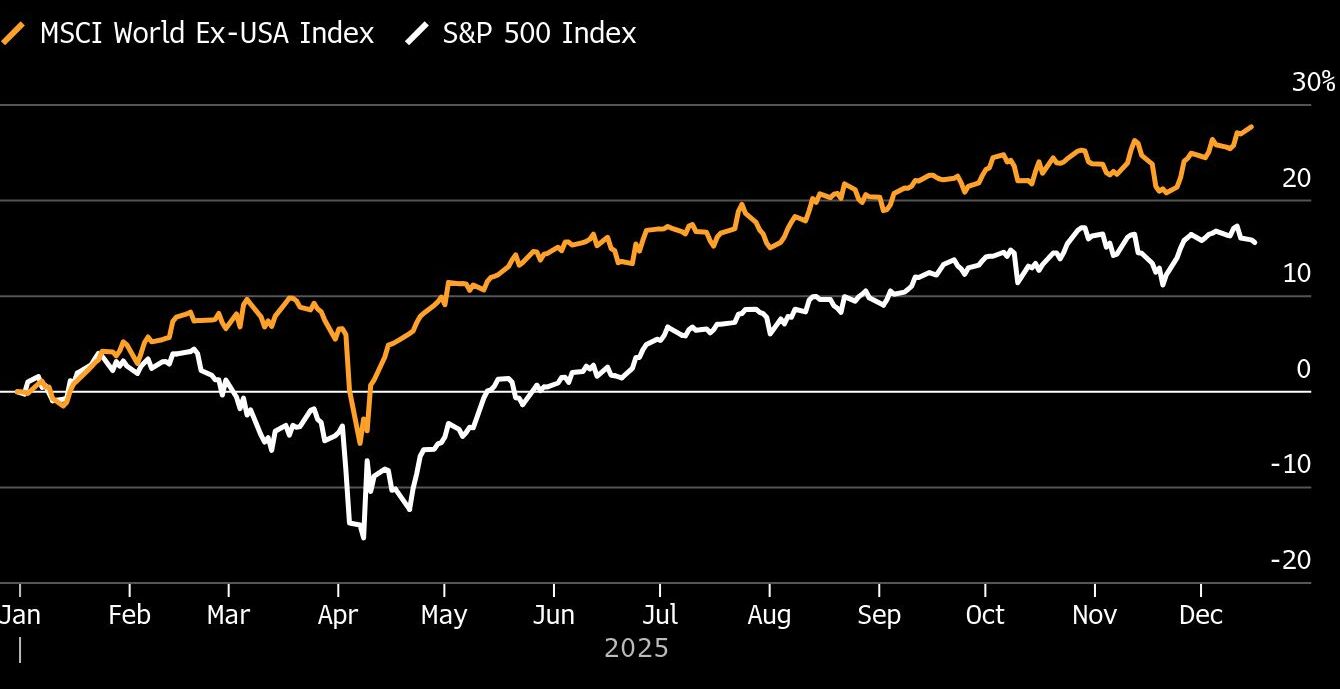
Stock gauges in Canada, the UK, Germany, Spain, Italy, Japan and Hong Kong have all outperformed the US benchmark. Strategists say this was a self-imposed punishment stemming from American policy uncertainty.
“I think what helped international is the turmoil that was occurring in the US, combined with the decline in the value of the US dollar,” said CFRA’s Stovall. In addition, he said international markets were due for a strong year against the S&P 500 after years of underperformance. “It was just a matter of time.”
More stories like this are available on bloomberg.com
©2025 Bloomberg L.P.